Case Study
Example: hERG Cardiotoxicity Dataset
- Example of using CHEESE on hERG dataset

- Dataset contains 648 molecules labeled 1 or 0 (blocking or non blocking)
- !! This tutorial uses premium API endpoints and will work only with CHEESE On-Prem installation !!
Prerequisities
- Python
- NumPy:
pip install numpy
- RdKit:
pip install rdkit
- Pandas:
pip install pandas
- NetworkX:
pip install networkx
- Matplotlib:
pip install matplotlib
import pandas as pd

herg = pd.read_csv('herg.csv')
herg_toxic = herg[herg['Y'] == 1]
herg_non_toxic = herg[herg['Y'] == 0]
|
Drug_ID |
Drug |
Y |
| 0 |
DEMETHYLASTEMIZOLE |
Oc1ccc(CCN2CCC(Nc3nc4ccccc4n3Cc3ccc(F)cc3)CC2)cc1 |
1.0 |
| 1 |
GBR-12909 |
Fc1ccc(C(OCC[NH+]2CC[NH+](CCCc3ccccc3)CC2)c2cc... |
1.0 |
| 2 |
CLOFILIUM PHOSPHATE |
CCCCCCC[N+](CC)(CC)CCCCc1ccc(Cl)cc1.CCCCCCC[N+... |
1.0 |
| 3 |
FLUSPIRILENE |
O=C1NCN(c2ccccc2)C12CC[NH+](CCCC(c1ccc(F)cc1)c... |
1.0 |
| 4 |
VANOXERINE HYDROCHLORIDE |
Fc1ccc(C(OCCN2CCN(CCCc3ccccc3)CC2)c2ccc(F)cc2)cc1 |
1.0 |
from rdkit import Chem
from rdkit.Chem import Draw
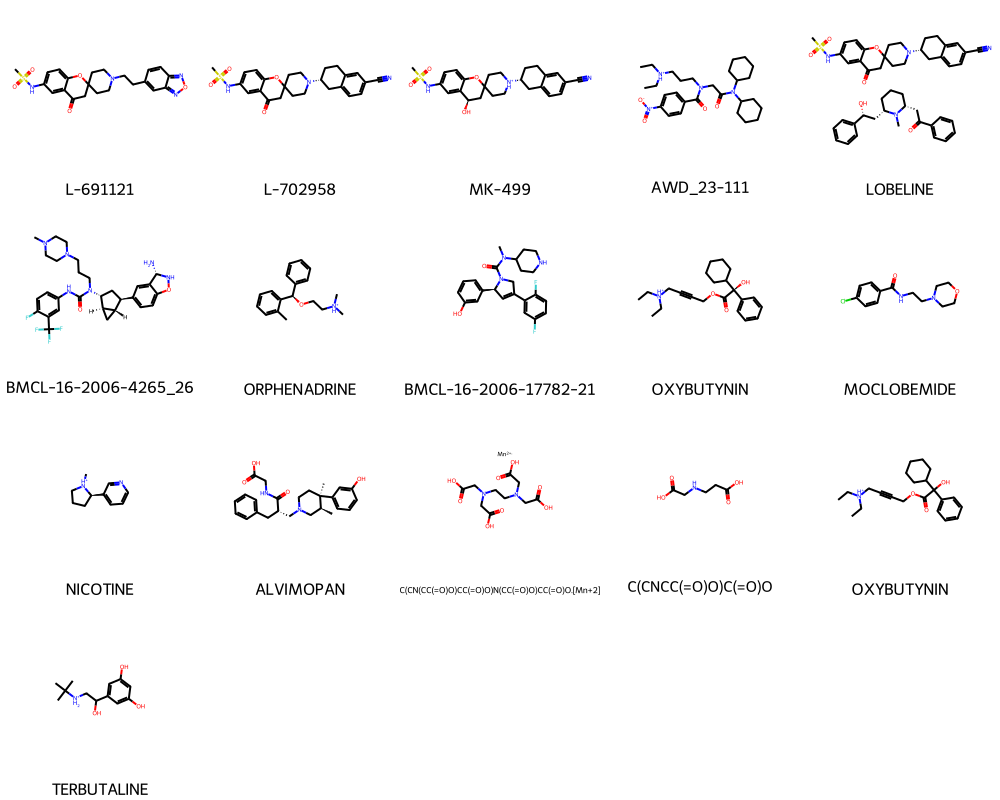
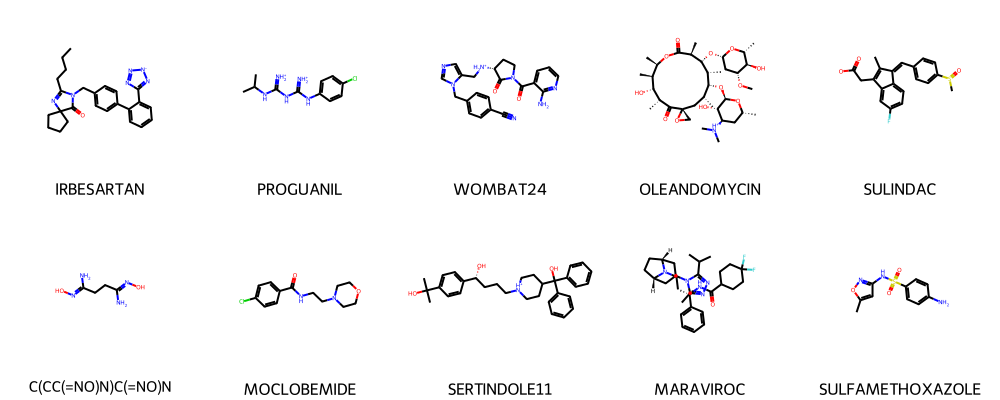
random_toxic = herg_toxic.sample(10)
random_non_toxic = herg_non_toxic.sample(10)
def plot_smiles(smiles, names):
mols = [Chem.MolFromSmiles(s) for s in smiles]
names = [str(s) for s in names]
return Draw.MolsToGridImage(mols, molsPerRow=5, legends=names)
plot_smiles(random_toxic['Drug'].tolist(), random_toxic['Drug_ID'].tolist())
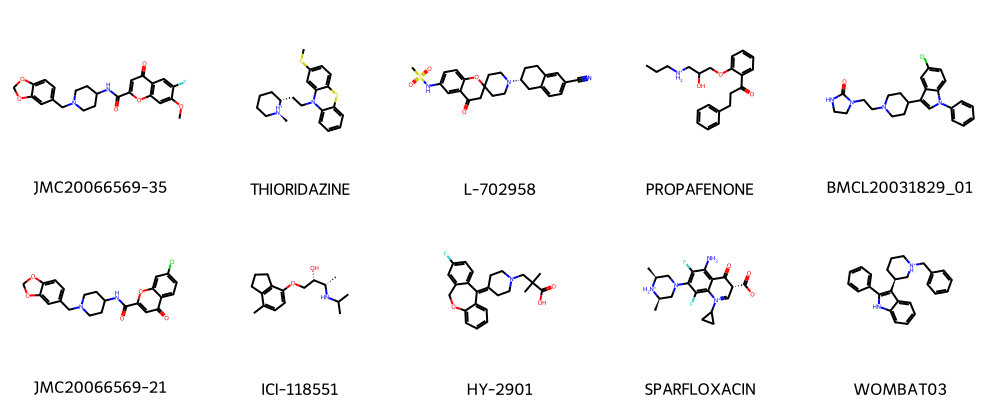
plot_smiles(random_non_toxic['Drug'].tolist(), random_non_toxic['Drug_ID'].tolist())
CHEESE Embeddings
import requests
import numpy as np

MY_URL = "http://cheese-database.ch.themama.ai:9002"
headers = {'accept': 'application/json'}

params = {
    "search_input": herg["Drug"].tolist(),
    "search_type": "espsim_electrostatic",
}

response = requests.get(MY_URL + "/embeddings", params=params, headers=headers)
embeddings = np.array(response.json()[params["search_type"]])
embeddings.shape
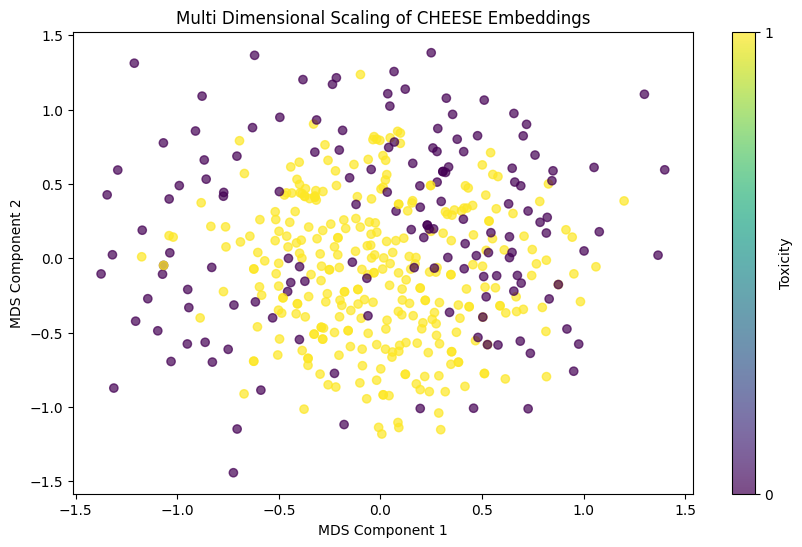
Multidimensionality Scaling
from sklearn.manifold import MDS

# Apply MDS to reduce the embeddings to 2D isometrically
mds = MDS(n_components=2, max_iter=500, n_init=10,  random_state=42)
reduced_embeddings_mds = mds.fit_transform(embeddings)

# Plotting the reduced embeddings and coloring by 'Y'
plt.figure(figsize=(10, 6))
scatter = plt.scatter(reduced_embeddings_mds[:, 0], reduced_embeddings_mds[:, 1], c=herg["Y"], cmap='viridis', alpha=0.7)
plt.colorbar(scatter, ticks=[0, 1], label='Toxicity')
plt.xlabel('MDS Component 1')
plt.ylabel('MDS Component 2')
plt.title('Multi Dimensional Scaling of CHEESE Embeddings')
plt.show()
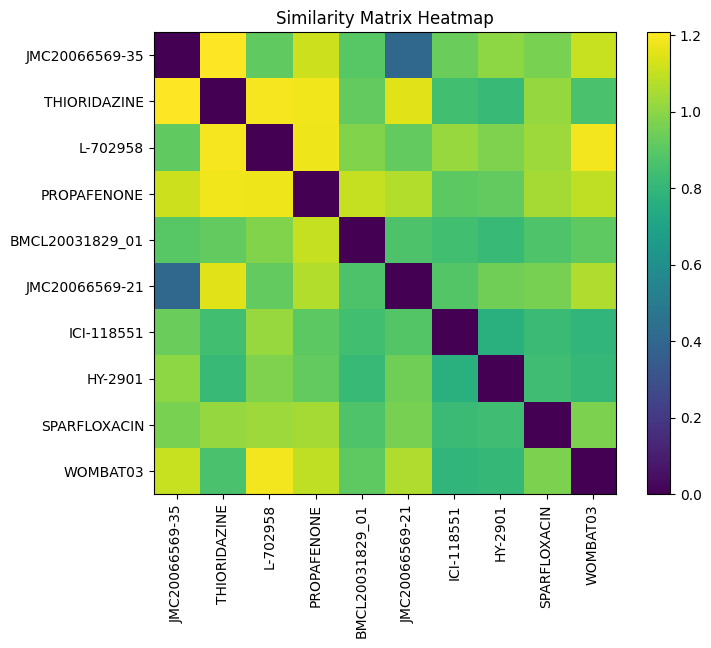
Similarity Matrix
params = {
    "smiles": random_toxic["Drug"].tolist(),
    "similarity_metric": "espsim_electrostatic",
    "distance_type": "euclidean"
}

response = requests.get(MY_URL + "/similarity_matrix", params=params, headers=headers)
sim_matrix = np.array(response.json()[params["similarity_metric"]])
import numpy as np
import matplotlib.pyplot as plt

names = random_toxic["Drug_ID"].tolist()

# Plotting the heatmap
plt.figure(figsize=(8, 6))
plt.imshow(sim_matrix, cmap='viridis', interpolation='nearest')
plt.colorbar()
plt.title("Similarity Matrix Heatmap")
plt.xticks(ticks=np.arange(len(names)), labels=names, rotation=90)
plt.yticks(ticks=np.arange(len(names)), labels=names)
plt.show()
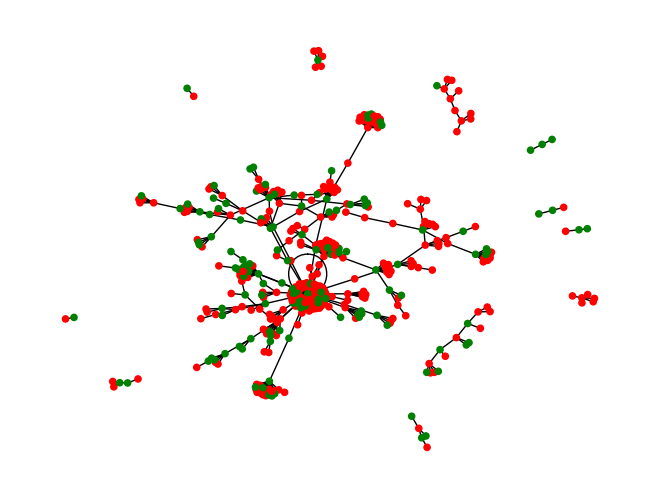
Similarity Network
params = {
    "smiles": herg["Drug"].tolist(),
    "similarity_metric": "espsim_electrostatic",
    "distance_type": "cosine"
}

response = requests.get(MY_URL + "/similarity_matrix", params=params, headers=headers)
sim_matrix = np.array(response.json()[params["similarity_metric"]])
import numpy as np
import networkx as nx
import matplotlib.pyplot as plt

drug_names = herg["Drug_ID"].tolist()
toxicity = herg["Y"].tolist()

# Create a graph
G = nx.Graph()

# Add nodes with attributes
for i, drug in enumerate(drug_names):
    G.add_node(drug, toxicity=toxicity[i])

# Add edges based on the similarity matrix
for i, row in enumerate(sim_matrix):
    # Get the indices of the 1 most similar item (excluding the item itself)
    most_similar_indices = np.argsort(row)[-2:-1]  # The last item is itself, so exclude it
    for j in most_similar_indices:
        G.add_edge(drug_names[i], drug_names[j], weight=row[j])

# Draw the graph
pos = nx.spring_layout(G)  # You can use other layouts as well
toxicity_colors = ['red' if toxicity == 1 else 'green' for toxicity in nx.get_node_attributes(G, 'toxicity').values()]

nx.draw(G, pos, with_labels=False, node_color=toxicity_colors, node_size=20) # ,# font_size=5, font_color='white')
plt.show()
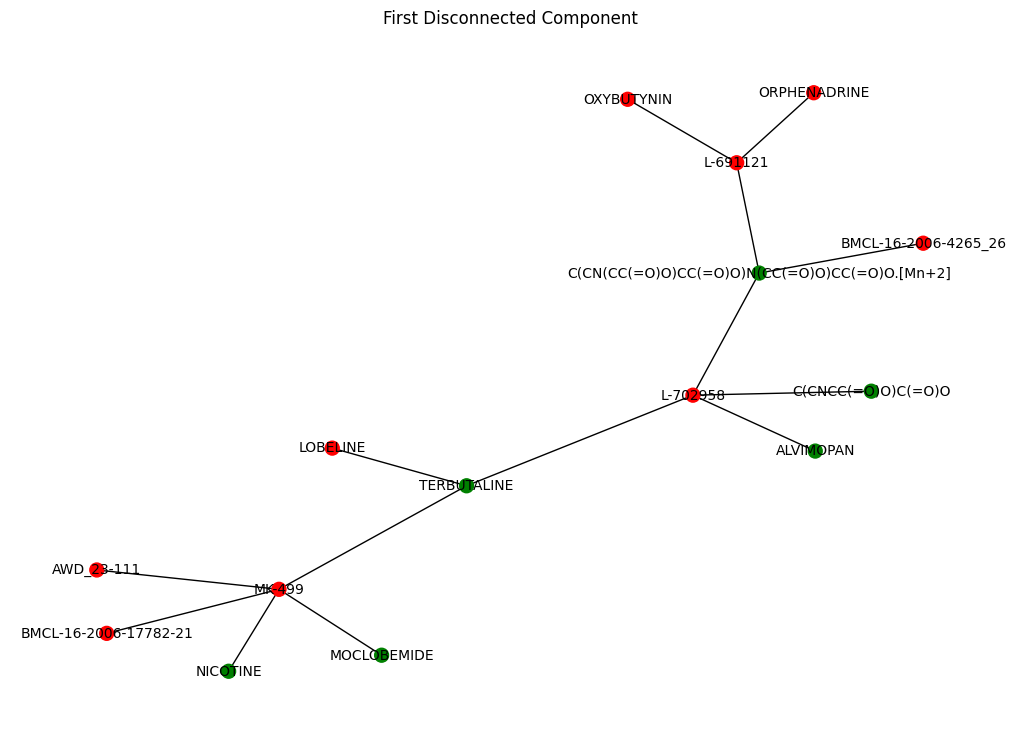
# Find the first disconnected component
components = list(nx.connected_components(G))
first_component_nodes = components[1]
first_component = G.subgraph(first_component_nodes)

# Draw the first disconnected component
pos = nx.spring_layout(first_component)  # Spring layout for the first component
toxicity_colors = ['red' if first_component.nodes[node]['toxicity'] == 1 else 'green' for node in first_component.nodes]

plt.figure(figsize=(10, 7))
nx.draw(first_component, pos, with_labels=True, node_color=toxicity_colors, node_size=100, font_size=10, font_color='black')
plt.title("First Disconnected Component")
plt.show()
compontent_dataframe = herg[herg["Drug_ID"].isin(list(first_component.nodes))]
compontent_dataframe.head()
|
Drug_ID |
Drug |
Y |
| 5 |
L-691121 |
CS(=O)(=O)Nc1ccc2c(c1)C(=O)CC1(CCN(CCc3ccc4non... |
1.0 |
| 15 |
L-702958 |
CS(=O)(=O)Nc1ccc2c(c1)C(=O)CC1(CCN([C@@H]3CCc4... |
1.0 |
| 23 |
MK-499 |
CS(=O)(=O)Nc1ccc2c(c1)[C@H](O)CC1(CC[NH+]([C@@... |
1.0 |
| 57 |
AWD_23-111 |
CC[NH+](CC)CCCN(CC(=O)N(C1CCCCC1)C1CCCCC1)C(=O... |
1.0 |
| 58 |
LOBELINE |
CN1[C@H](C[C@@H](O)c2ccccc2)CCC[C@@H]1CC(=O)c1... |
1.0 |
plot_smiles(compontent_dataframe['Drug'].tolist(), compontent_dataframe['Drug_ID'].tolist())